

The average inventory turnover ratio across industries ranges between 5 and 10 times per year.(Source: CSIMarket, 2025)
What Is Inventory Turnover Ratio?
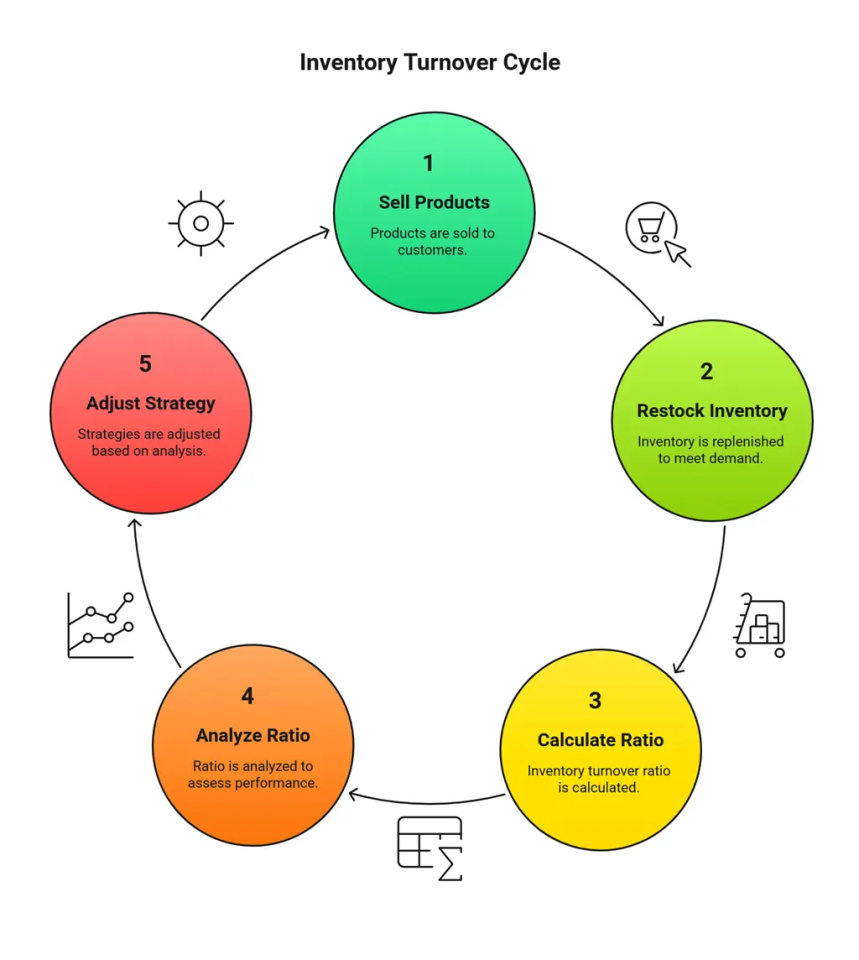
Inventory turnover ratio shows how many times a business sells and replaces its entire stock of products during a set period, usually a year. This ratio helps companies track how quickly inventory is turning into sales.
In simple terms, if your inventory turnover ratio is 5, you sold and restocked your average inventory 5 times in a year.
Why Is Inventory Turnover Ratio Important?
This ratio tells you if your stock is moving fast or just sitting in storage. A higher inventory turnover ratio usually means:
- Products are selling well.
- Stock isn’t gathering dust.
- Your business might make more profit since less money is tied up in unsold goods.
A lower ratio might mean:
- Products aren’t selling fast enough.
- You have too much inventory on hand.
- There’s a higher risk of goods getting old, spoiling, or going out of style.
Quick Quote:
“Retailers that turn inventory into sales faster tend to outperform comparable competitors.”
Key 2025 Inventory Turnover Stats
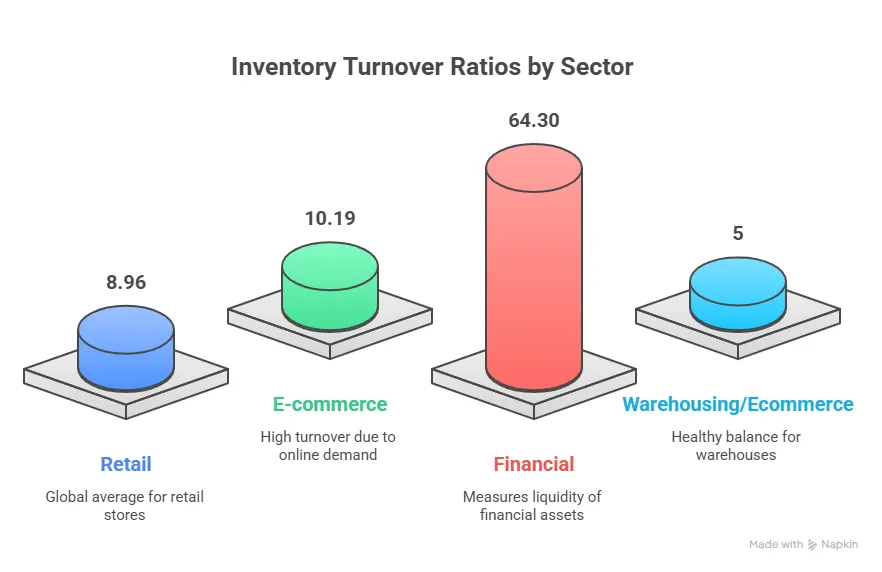
- Retail industry (global average): The retail industry had a global average inventory turnover ratio of 8.96 in Q2 2025, which means retail stores on average sold and replaced their stock nearly nine times in a year—this signals efficient inventory management and steady sales.
- E-commerce: E-commerce reached an average ratio of 10.19 in Q4 2024, showing products moved even faster, likely due to high online demand and quick restocking.
- Financial sector (for context): The financial sector showed a much higher ratio of 64.30, but this measures how liquid financial assets move and is not directly comparable to how physical products turn over in most industries.
- Warehousing/Ecommerce: For warehouses and e-commerce, a ratio close to 5 is generally seen as good, showing a healthy balance between keeping enough stock for customers and not tying up too much money in inventory.
The Inventory Turnover Ratio Formula
The formula is straightforward:
Inventory Turnover Ratio=Cost of Goods Sold (COGS)/Average Inventory
COGS (Cost of Goods Sold) is how much you paid to buy or make your products for the year
Average Inventory is figured out like this:
Average Inventory=Beginning Inventory+Ending Inventory/2
Inventory Turnover Ratio: Step-by-Step Example
Suppose you own a small clothing shop. Here are your numbers from last year:
- Cost of goods sold (COGS): $60,000
- Beginning inventory: $15,000
- Ending inventory: $25,000
Step 1: Calculate average inventory:
15,000+25,000/2=20,000
Step 2: Plug into the ratio formula:
Inventory Turnover Ratio=60,000/20,000=3
This means you sold and refilled your average stock three times last year.
What Is a Good Inventory Turnover Ratio?
“Good” depends on your industry and business type. Here are some typical averages for 2025:
| Industry | Average Ratio |
|---|---|
| Retail (Global) | 8.96 |
| E-commerce | 10.19 |
| Small Retailer | 6.25 |
| General Warehousing | 5 |
| Fast Food | 100–150 |
| Restaurants | 4–8 |
| Manufacturing | 6–12 |
| Pharmaceuticals | 2–4 |
Note: High turnover (over 10) often fits fast-paced businesses like e-commerce or fashion, where styles and demand change quickly. Lower turnover (2–4) might work for industries where products have a longer shelf life.
More Examples for Clarity
Bookstore Example
- COGS: $10,000
- Beginning Inventory: $3,000
- Ending Inventory: $1,000
Average Inventory: $(3,000 + 1,000)/2 = $2,000$
Inventory Turnover Ratio: $10,000 / 2,000 = 5$
Interpretation: The bookstore sold through its stock five times that year. On average, it takes about 73 days to sell all inventory once:
365÷5=73 days
Walmart’s 2023 Calculation
- Cost of Sales: $463,721 million
- Inventory Average: ($56,511M + $56,576M)/2 = $56,543.5$ million
- Turnover Ratio: $463,721M / 56,543.5M = 8.20$
This means Walmart replaced its entire stock about 8 times in one year.
How Does Inventory Turnover Ratio Help You?
- Spot Slow Sellers: Find products that stay on shelves too long.
- Improve Cash Flow: Reduce unsold stock and free up money for other needs.
- Decide When to Restock: Know when it’s safe to order more without overbuying.
- Boost Profits: Sell products faster, pay less for storage, and avoid spoilage or becoming outdated.
- Better Buying Decisions: Learn what customers want and stock accordingly.
High vs. Low Inventory Turnover: What Do They Mean?
High Inventory Turnover Ratio:
- Fast sales
- Stock runs out quickly
- Could risk running out if not careful
Low Inventory Turnover Ratio:
- Slow sales
- Stock not selling fast enough
- May lead to discounts or write-offs
Quote:
“A high inventory turnover ratio suggests efficient sales and inventory management, while a low turnover may indicate overstocking or sluggish sales.”
Tips to Improve Your Inventory Turnover Ratio
- Forecast demand carefully: Use sales history to predict what’s needed.
- Order smaller batches more often: Don’t let goods pile up.
- Discount slow-moving items: Boost sales and free space for newer products.
- Use inventory management software: Track sales and reorder points automatically.
Common Mistakes to Avoid
- Don’t use total sales instead of COGS in your formula-this makes your ratio look better than it is.
- Always match your COGS and inventory numbers to the same time period.
- Watch for seasonal upswings or downturns that can affect averages.
Inventory Turnover Ratio Table: Quick Reference
| Business Type | COGS | Avg. Inventory | Ratio | Average Days to Sell |
|---|---|---|---|---|
| Small Retailer | $150,000 | $24,000 | 6.25 | 58 |
| Bookstore (per item) | $10,000 | $2,000 | 5 | 73 |
| Walmart (2023) | $463,721M | $56,544M | 8.20 | ~45 |
Conclusion
The inventory turnover ratio is a simple but powerful way to measure how well a business moves stock and makes sales. A good ratio depends on your industry, but keeping an eye on this number helps you make smarter choices in buying, selling, and storing products. If your inventory turnover ratio is low, think about what changes will get products moving again, like specials or new marketing ideas.
By checking this ratio regularly, you’ll keep your business healthy, avoid wasted stock, and understand your customers better-all with just one easy calculation.
Frequently Asked Questions(FAQ’s)
1. How can GOIS help improve my inventory turnover ratio?
GOIS helps you track sales trends, reorder points, and stock movement in real time. With this visibility, you can restock faster, avoid overstocking, and maintain a healthy turnover ratio that improves cash flow.
2. What’s a good inventory turnover ratio for my business?
It depends on your industry. For example, retail averages around 8–9, while e-commerce often reaches 10 or higher. GOIS provides detailed analytics so you can benchmark your performance against industry averages and set realistic goals.
3. Can GOIS integrate with my existing e-commerce or accounting systems?
Yes. GOIS integrates seamlessly with platforms like QuickBooks, Shopify, WooCommerce, and more helping you sync sales, purchases, and inventory automatically for accurate turnover calculations.
4. How does GOIS prevent overstocking or stockouts?
GOIS uses smart alerts and reorder automation. You can set minimum and maximum stock levels, so the system notifies you before you run out or when you’re holding too much keeping your inventory flow efficient.
5. Does GOIS provide insights or reports on inventory performance?
Absolutely. GOIS offers visual dashboards and custom reports that show turnover rates, slow-moving products, and profit margins—helping you make quick, data-backed decisions to optimize inventory health.
Jessica Cuthbert 
Jessica Cuthbert is a technology and operations writer specializing in inventory systems and ERP, focusing on solutions like Goods Order Inventory (GOIS) to help businesses streamline processes and adopt data-driven inventory management.